Research Program
AI Research
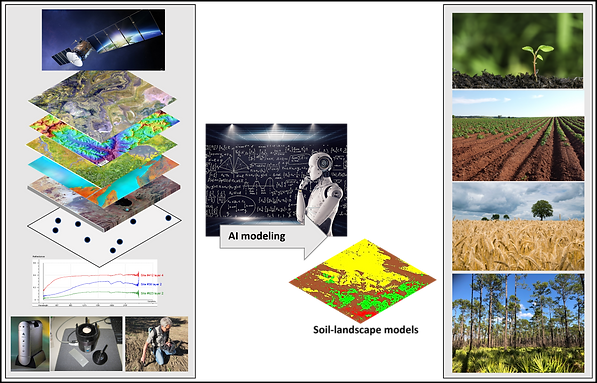
Artificial intelligence (AI) has been pivotal to model soils, soil-landscapes, and ecosystem conditions. Since the mid 1990s our research team has extensively used AI algorithms to model:
-
Soil organic carbon (SOC) and carbon fractions (pools)
-
Soil N, P, , texture, Ca, Mg, Fe and other soil health properties
-
Various biogeochemical properties
-
Soil indices
-
Ecosystem functions
-
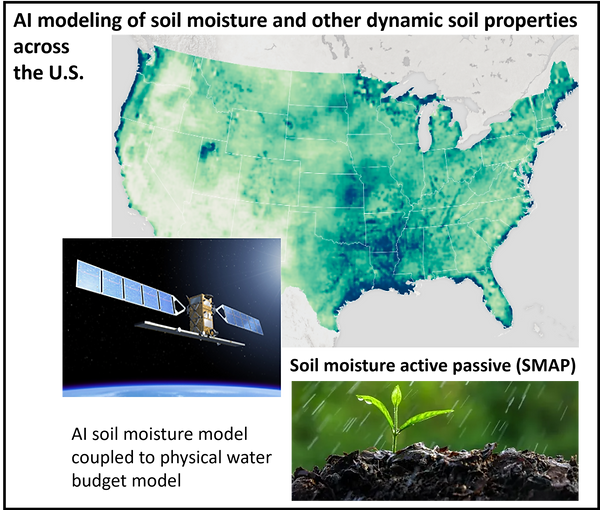
Soil moisture and other dynamic soil properties (new project)
under diverse soil, climatic, hydrologic, and land use conditions in multiple regions (Florida, Texas, U.S., Brazil, Denmark, India, Indonesia, Peru).
AI models are computed using soil-climatic-hydrologic-lithologic-topographic-biotic-economic-social/human BIG datasets. Sensing technology (soil proximal sensing and remote sensing) combined with geotechnologies and field data collection provide rich dataset that feed AI engines. We have used AI to develop predictive soil models from proximal soil sensing (visible-near-infrared and mid-infrared spectra).
AI methodology:
-
Machine learning and deep learning AI
-
Algorithms such as Random Forest, Boosted Regression Trees, Cubist, Support Vector Machines, Convolutional Neural Networks (CNN), Long-Short Term Memory (LSTM), Multi-Perceptron Neural Networks.
Applications:
Optimization of soil carbon sequestration, assessment of attainable soil carbon storage, climate smart agriculture, regenerative agriculture, soil health and ecosystem services.
Climate Smart Agriculture & Carbon Management
Adopting carbon-sequestering and climate-smart practices (CSCS) by fruit and vegetable growers represents a significant opportunity for establishing consumer-driven markets, enhancing land-based carbon sequestration and ecosystem services, improving soil, crop, and human health and resilience, and enabling growers to participate in carbon markets.
Carbon-sequestering and climate-smart (CSCS) practices
-
Nutrient management
-
Residue and tillage management (reduced tillage; no-tillage)
-
Alley cropping
-
Short season cover crops
-
Water management
-
Soil amendments (biochar, biologicals)
Project Overview:
-
Funding program: U.S. Department of Agriculture (USDA) Natural Resources Conservation Service (NRCS) Partnersh8p for Climate-Smart Commodities.
-
Project title: A Vibrant Future - Pilot Projects for Climate-smart Fruit and Vegetable Production, Marketing, and Valuation of Ecosystem Services.
-
Principal Investigator: M. Teplitski, International Fresh Produce Association (IFPA), Washington, D.C. (total project budget: US $15 million - press release).
-
Co-PI: S. Grunwald, UF (carbon assessment and AI modeling).
Project Goals:
-
Quantification methods of carbon additionality and avoidance of CSCS practices in specialty crops (West coast of U.S. and southeastern U.S.)
-
Comparison of greenhouse gas emissions (GHG) and soil organic carbon sequestration (SOCseq) in conventional tillage and with CSCS practices in specialty crops.
Data:
-
Greenhouse gas (GHG) emission and SOCseq measurements in field plots and growers sites/farms
-
Regional geodata: SOC, crop and water management, climate, and environmental geodata
-
Sensor data: Satellite images, portable field and lab-based proximal soil sensing (visible-near-infrared spectroscopy)
Methods:
-
AI (machine learning and deep learning) modeling: Soil carbon, spectral predictive soil health modeling, GHG emissions, land-based carbon budgets, soil and crop health
-
AI modeling of ecosystem services
-
AI modeling of CO2 emissions from satellite images
-
Carbon and GHG emissions: Measurements and AI modeling
-
Integration of data and results into the COMET tool


Soil Health
Understanding soil health is critically important to enhance food security, sequester carbon, and sustain various ecosystem functions.
Our research approach to assess soil health is multi-dimensional and involves to:
-
Assess soil organic carbon (SOC) and carbon fractions (pools)
-
Model carbon dynamics
-
Quantify spatially various biogeochemical soil properties
-
Develop soil indices to optimize soil health
-
Sense soil properties using rapid and cost-effective proximal sensors such as visible/near-infrared and mid-infrared spectroscopy
Research methods:
-
Digital soil mapping and pedometrics
-
Machine learning and deep learning (AI), e.g. Random Forest, Cubist, Support Vector Machines
-
Bayesian modeling
-
Data Envelopment Analysis
-
Latent variable methods
-
-
Earth simulation modeling, e.g., DayCent, RothC
Pedometrics & Digital Soil Mapping
Pedometrics is the development and application of statistical and mathematical methods applicable to data analysis problems in soil science. This discipline has focused to estimate / simulate / predict soil properties and classes, model soil behaviors, and assess accuracies and uncertainties.
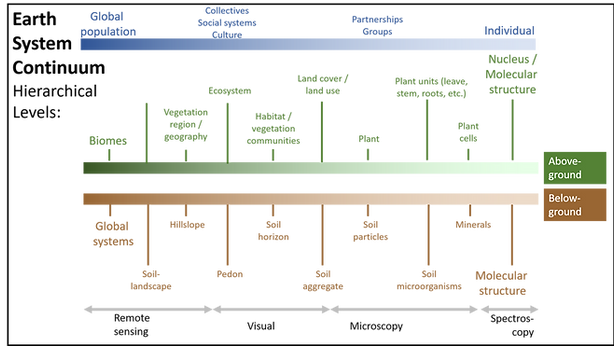
The goal of Digital Soil Mapping (DSM) is to create digital representations of soils that occur in nature. In general, estimations or predictions of soil attributes/classes are computed using environmental covariates and stochastic, deterministic, or hybrid algorithms. Machine learning and deep learning algorithms are at the frontier of DSM. Conceptual soil-factorial models, such as CLORPT and SCORPAN, have served to develop digital soil maps and models. Grunwald (2009) presented an extensive review of multi-criteria characterization of DSM rooted in SCORPAN.
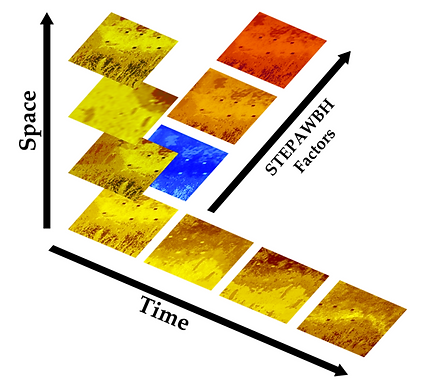
Grunwald et al. (2011) enhanced these soil-factorial models and presented the STEP-AWBH space-time soil model, which provides the following advantages:
-
Incorporation of multiple factors that represent the totality of soil-ecosystems: S: soil, T: topography, E: ecology, P: parent material, geology, A: atmosphere/climate, W: water/hydrology, B: biota and organisms, and H: human variables/factors that determine soil formation.
-
Integration of spatially- and temporally explicit soil-forming factors (STEP-AWBH factors; soil-environmental covariates) into a quantitative model approach (e.g., machine learning, Bayesian, or regression model) to infer on soil properties/classes and their evolution.
-
The STEP-AWBH factors are populated using geospatial technologies including remote and soil proximal sensing, measurements, or available databases.
-
It explicitly incorporates anthropogenic forcings including social, cultural, economic, legislative or other data.
-
Incorporates bio-, topo-, litho-, pedo- and hydro-sphere.
-
Fuses empirical and process-based knowledge.
The STEP-AWBH model framework has been adopted in various DSM research papers to model soil properties and uncertainties (e.g., Xiong et al. 2014; Adi and Grunwald, 2020).


Pedo-Econometrics
Pedo-econometrics is a progressive and emergent field that allows to quantify complex concepts, such as soil health, soil security, and ecosystem efficiency (Mizuta et al. 2018). This novel approach goes beyond simple predictions of soil biogeochemical properties or indicator assessment.
The Data Envelopment Analysis framework facilitates to compute efficiencies of soil and ecosystem functions (e.g., carbon sequestration efficiency, efficiency of net primary productivity, water regulation efficiency, biodiversity efficiency). Input orientation efficiency scores are interpreted in such a way that a given quantity of outputs (e.g., a target sequestration value of soil carbon sequestration) can be achieved by adjusting the quantity of inputs (e.g., fertilization, management, or land use change), while output orientation efficiency scores infer on the degree of outputs that can be produced with given sets of site-specific environmental inputs (e.g., soil and land use condition, climatic factors, topography). Various pedo-econometrics studies using the DEA were presented by Mizuta et al. (2019, 2021a, b, c).
Research methods:
-
Data Envelopment Analysis
-
Stochastic Frontier Analysis
-
Local and global frontier analysis; meta-frontier analysis
Soil Security
We advocate for an integral approach rooted in Integral Theory and Integral Ecology to assess soil security. Grunwald et al. (2017 book chapters) defined soil security as the freedom from risks of losing (1) a specific or a group of soil functions, (2) goods and services that soils provide to benefit humans, and (3) in its broadest sense, sustainability of life on Earth. We assert that understanding soil security goes beyond simple assessment of soil properties because it requires integration of social and environmental dimensions.
Integral soil security aims to support global policy (Koch et al. 2013). Grunwald et al. (2016, 2017a, b; book chapters) envisioned the Meta Soil Model that integrates the following perspectives:
-
Individual psycho-spiritual subjective experiences and relations of/with/about soils / nature / environment ("knowing through felt experience").
-
Collective values, beliefs, perceptions, ethics of soil / land / nature / environment ("knowing through socially constructed culture").
-
Quantitative knowledge of soils, ecosystem processes , pedogenesis, and use of soils / land ("knowing by observation and measurements").
-
Systems that soils are part of, such as economic, ecological, social, political, legal and educational systems ("knowing through system analysis").
According to Richter et al. (2011), human-soil relations are changing rapidly and we lack understanding how change affects human well-being. Meta soil modeling explores human-soil relations through a pluralistic integration approach acknowledging subjective individual (e.g., a farmer, CEO, you and me), community (e.g., soil professional societies, rural and urban communities), facts and data (e.g., soil databases, use of soils), and system perspectives (e.g., regulations pertaining to land use).


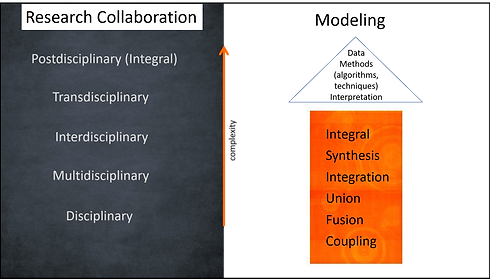
Integral Ecology
Integral ecology provides a philosophical framework to study social-environmental phenomena and cultural understanding of soil / land / nature / environment. Soil degradation, loss in soil health, food security, and global climate change, like many of society’s ‘wicked’ environmental problems, share similar characteristics. They are global, complex, difficult to resolve and are interconnected across environmental, social, cultural, and political spheres, and present a risk to society.
Integral ecology is rooted in Integral Theory (see Ken Wilber's work American philosopher) that recognizes four distinct lenses or perspectives: (1) I perspective (subjective beliefs, values, experiences; (2) WE perspective (group, community beliefs, values, morals, ethics, communication); (3) IT perspective (objective things; e.g., soil measurement, satellite data); and (4) ITS perspective (educational, ecological, technological, legal, social and other systems).
To understand the totality of an soil-ecosystem rests on the integration of all four integral perspectives. Integral Methodological Pluralism posits that the use of multiple contrasting methods/approaches reveals more knowledge and understanding rather than reductionist science focused on only one approach (e.g., soil org. C measurements).
Grunwald’s research team advocates integral thinking that aims to integrate environmental, social, and psychological perspectives to model the totality of ecosystems. Integral Soil Meta Models were conceptualized in several book chapters (Grunwald et al. 2016, 2017a, b).
The integral model views humans through different lenses: (1) I perspective: Subjective interior experiences of individuals (body, emotional, and mindful awareness), personal beliefs, feelings; embodiment of one's own being - phenomenology; (2) WE perspective: Shared beliefs, values, morals, ethics, etc. of communities - cultural phenomena; (3) IT perspective: objectified humans (biophysical and chemical measurements of people, observable behavior of people (e.g., land use management) as studied through an experimental distancing researcher lens; and (4) ITS perspective: commodified humans as nodes or numbers in a social larger whole.
In contemporary soil-factorial and pedogenesis simulation models the human is often reduced to a node in a system (IT and ITS perspectives), for example, in form of land use categories or management type in an ecosystem consisting of mappable elements (e.g., "soil as an object"). But this view misses the point of human-created ecosystems in which people are agents with their own thinking, behaviors (rational, sometimes irrational), spiritual/religious beliefs, core values, feeling tones (e.g., compassion, angry), attitudes towards the world (e.g., exploit the land for profits, nature is sacred, land is a commodity to produce food), and states of being (e.g., level of happiness). The integration of social, psychological, and anthropological research methods (e.g., surveys, questionnaires, interviews, focal groups) and pedometrics offers potential to expand our understanding of complex wicked environmental problems that are paradoxical and do not have a single solution.
Soil Carbon Meta Model Florida

Soil Carbon Sequestration
Rising CO2 emissions in the atmosphere and effects of global climate change have been widely documented and future impacts on soil-ecosystems are uncertain but potentially devastating. Soil carbon (C) sequestration has been suggested to mitigate global climate change providing long-term storage of C in the soil. Carbon fluxes between soil, biotic, and atmospheric pools are dynamic in space and through time and dependent on a multi-factorial system of environmental and anthropogenic drivers.
Dr. Grunwald’s research is focused to quantify C sources, sinks, and ecosystem processes that modulate regional C systems to identify imbalances and counteract global climate change. Her research team estimated that 2.256 Pg C is stored in Florida’s soils, more than in any other state in the conterminous U.S.. According to our empirical study in Florida based on thousands of soil samples, the mean soil organic C (SOC) in the topsoil (0-20 cm) was 4.67 kg m-2 (historic data, 1965-1996) and 4.98 kg m-2 (2008/2009) suggesting that overall soils have acted as a sink for C; though with distinct differences among land use types (Xiong et al., 2014a, b). SOC sequestration within the St. Johns River Basin Florida was 0.8 g C m-2 yr-1 over a 40 year period with soils acting as a net C sink for atmospheric C (Ross et al. 2013).
To assess the impact of this carbon science research it was estimated by Grunwald and colleagues that evolving C markets could support greenhouse gas mitigation through forestry and agriculture, i.e. green technologies (e.g., biofuels, biogas, afforestation, conservation tillage, residue management) equal to a value of $340 million per year as C credits for the State of Florida. Grunwald and her team also assessed how land use shifts may impact C stocks and pools. Implementation of conservation tillage on half of Florida’s cropped lands equal carbon credits of about $34.4 million.


.png)
Soil Carbon Stocks in Florida, USA
Dr. Grunwald’s USDA-funded project ‘Rapid Assessment and Modeling of Soil C Storage and Pools across Florida’ is a Core Project of the North American Carbon Program (NACP). The research project involved upscaling of site-specific soil C stocks and C pools (fractions) to infer on processes using advanced geostatistical methods, machine learning, GIS, and remote sensing (DSM and pedometrics approaches). The response of land use shifts and global climate warming on Florida’s soil C budgets was assessed.
Major significant factors to explain SOC variation were vegetation and soil hydrology, followed by climatic factors. The surface 20 cm soils acted as a net sink for C with the median soil organic C (SOC) significantly increasing from 2.69 to 3.40 kg m-2 over the past decades (1965 – 2009) (Xiong et al., 2014a, 2014b). These findings were derived using a suite of machine learning / artificial intelligence algorithms. Keskin et al. (2019) compared various machine learning methods to assess soil C fractions (recalcitrant C, labile C, total C) in the topsoil of Florida (~150,000 km2). Adi and Grunwald (2020) provided a novel latent variable approach to model soil C fractions in Florida. Knox and Grunwald (2018) used visible-near-infrared and lab-based soil total C measurements and upscale them to the Florida state scale.
The land use influence on C, nitrogen (N), extractable phosphorus (P), and short-term anaerobically mineralizable P in specific soil size fractions was studied to better understand C, N, P dynamics, specifically immobilization and mobilization behavior (Bliss et al. 2013). Carbon mineralization and labile organic C pools were studied to elucidate on C dynamics in sand-rich soils in North Florida (Ahn et al. 2009). Soil aggregates and C mineralization was studied to gain insight into the mechanisms underlying mineralization in loblolly and slash pine ecosystems of Florida (Azuaje et al., 2012).
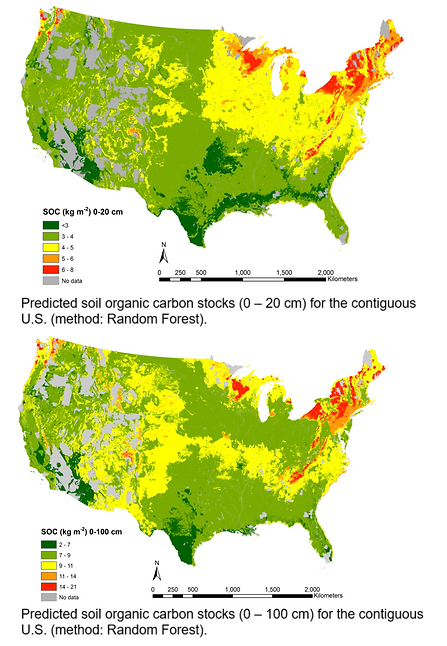
Soil Organic Carbon Modeling
Graduate student Baijing Cao, with extensive support from Dr. Grunwald and her research team, harmonized geospatial soil-environmental data, including digital elevation models, remote sensing, and other GIS data into a Big Data hypercube covering the US. Geospatial data were combined with soil organic carbon (SOC) measurements from the National Cooperative Soil Survey (>15,880 sites). The widely used machine learning method Random Forest was used to make SOC predictions across the U.S.
Model performance for SOC (0-20 cm) showed a 0.86 R2, 1.33 kg m-2 RMSE, 2.35 RPIQ in calibration mode, and 0.46 R2, 2.40 kg m-2 RMSE, and 1.31 RPIQ in validation mode. Model performance for SOC (0-100 cm) showed a 0.88 R2, 3.73 kg m-2 RMSE, and 1.83 RPIQ in calibration mode, and 0.43 R2, 6.99 RMSE, and 0.96 RPIQ in validation mode. (see maps: B. Cao and S. Grunwald).
A simulated annealing approach combined with Random Forest was used to simulate actual and attainable SOC in the Suwannee River Basin (Chaikaew 2014; Ph.D. dissertation). The potential to sequester more C on sites under row/field crops was higher than wetlands due to site-specific environmental factors.
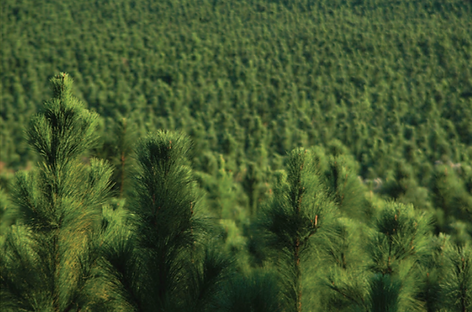
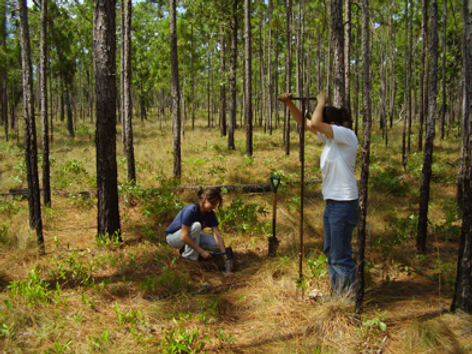

Pinemap
In the $20 million PINEMAP research project (http://pinemap.org; Pine Integrated Network: Education, Mitigation, and Adaptation project; 2011-2017) funded by the U.S. Department of Agriculture (USDA) National Institute of Food and Agriculture (NIFA) we assessed the impact of global climate change on 20 million acres of planted pine forest in the southeastern U.S. (PI: T.A. Martin; one of the 50 co-PIs: S. Grunwald). PINEMAP evaluated adaptation and mitigation strategies and economic and ecological services using monitoring and modeling approaches. The Terrestrial Data Management System developed through funds of the Florida Energy Systems Consortium (FESC) was used for project data management.
In a sub-project of PINEMAP, Dr. Grunwald’s teams focused on modeling of terrestrial carbon dynamics. Climate projections indicate that the southern U.S. will become warmer and potentially drier by the end of the 21st century. The overarching objectives were to: (1) quantify current terrestrial carbon stocks across the southern US, and (2) assess the response of forest productivity and carbon cycling to climate perturbations. Her team used (1) soil and ecosystem measurements at 4 high-intensity study sites (tier 1) and 326 regional sites (tier 2); (2) remote sensing and geospatial environmental BIGDATA sets; and (3) mechanistic (DayCent model) and machine learning methods. Regionally downscaled representative concentration pathways (ICP's RCP 4.5 and 8.5) were used to represent a range of potential climate scenarios.
Research significance: DayCent simulations covering the measurement period (2012 to 2014) were validated with field-based data and indicated robust agreement across the region, with mean absolute percentage error ranging from 6% for soil organic carbon to 51% for net primary productivity. DayCent forecasts to the end of the 21st century demonstrate that forest productivity is clearly sensitive to climate perturbations. Our findings suggest that the terrestrial carbon sink capacity of pine forests will increase under a broad range of potential climate scenarios (Ross's PhD dissertation).
We estimated that 2.6 Pg of soil carbon is currently stabilized in the upper 100 cm of production forestland, which covers 34.7 million ha in the southeastern US. using Random Forest machine learning (Ross et al., 2020). We showed that although C ranges from 0.3 to 8.2 kg m-2 in the topsoil (0 to 20 cm), and from 0.4 to 17.6 kg m-2 in the subsoil (20 to 100 cm), this variability is predictably distributed based on patterns of precipitation, soil moisture, nitrogen and sand content, gamma ray emissions, mean annual minimum temperature, and elevation.
Soil Carbon Modeling in the Andes, Peru
The Andes represent the largest and highest mountain range in the tropics. Even though the Andean Region in Peru is among the most threatened of ecosystems under current predicted global warming scenarios, there is a lack of knowledge on the interactive effects of land use, topography, and climate on soil carbon dynamics in this fragile ecosystem.
In this project (Principal Investigator: Dr. Grunwald) funded by the CGIAR-International Potato Center, CIP) we aimed to use proximal soil sensing (visible-near infrared and mid-infrared spectroscopy), geospatial and remote sensing technologies, digital soil mapping (STEP-AWBH approach), and simulation modeling (Roth-C) to assess the spatial distribution and evolution of SOC across the region. The overall goals of the project are to (1) gain insights into the complex interrelationships between soils, topography, climate and humans in this remote and understudied region, and (2) model soil carbon patterns based on AI (machine learning or deep learning), and (3) soil carbon evolution over time using a quasi-mechanistic simulation model.
Graduate student Carla Gavilan worked on this project from 2012 to 2020. Soil sampling was done using Latin-Hypercube design at 400 sites and lab analysis of multiple soil properties is complete; a large set of environmental covariates were assembled. The research is unpublished.


Soil Spectral Modeling
Various soil spectral libraries (based on visible/near-infrared, VNIR; and mid-infrared, MIR, spectroscopy) and applications have been generated by Grunwald's team and research collaborators for Florida, Hawaii, the U.S., Denmark, regions in Texas, Brazil and India, and at global scale (Clingensmith and Grunwald, 2022; Vasques et al. 2009; Vasques et al. 2010; Ge et al. 2011; Sarkhot et al. 2011; McDowell et al. 2012a; McDowell et al. 2012b; Sequeira et al. 2014; Knox et al. 2015; Peng et al., 2015; Viscarra Rossel et al. 2016; Dotto et al. 2017; Pinheiro et al. 2017; Clingensmith et al. 2018; Dotto et al. 2018; Knox and Grunwald, 2018; Dematte et al. 2019; Moura-Bueno et al. 2020; Moura-Bueno et al. 2021).
Soil spectral data allow cost-effective, accurate, and rapid proximal sensing through predictive modeling (e.g., machine learning algorithms such as Random Forest, Support Vector Machines, and Cubist; and deep learning algorithms – artificial intelligence) of multiple soil properties (e.g., soil organic carbon (SOC), C fractions such as recalcitrant and labile C, soil texture, pH, cation exchange capacity, macro- and micronutrients, and more).
Grunwald's research team also investigated spiking, transfer, and scaling behavior of spectral models (Grunwald et al. 2018). Soil proximal sensing has demonstrated it's usefulness to characterize soils in many different landscape settings.
Remote Sensing
Remote-sensing is instrumental to characterize land cover, land use, biomass, and derive vegetation indices. All these data can be integrated into digital soil models or Earth simulation models to enhance our biogeochemical understanding;, or used to assess change in above-ground vegetation patterns.
Remote sensing was used in research in aquatic systems (e.g., the Greater Everglades) to develop soil phosphorus (P) and soil nitrogen (N) models (e.g., Rivero et al 2007, 2009; Kim et al. 2014) andr soil class models (e.g., Kim et al. 2012). High-resolution remote sensing was used to develop soil prediction models in smallholder farm settings in India (e.g., Xu et al 2017a, b, c; and 2018a, b).
A comprehensive review article of proximal soil sensors, remote sensors and how spectral data can be fused to improve soil model predictions was presented by Grunwald et al. (2015).
Remote sensing along with GIS have been instrumental to populate digital soil models in aquatic and terrestrial ecosystems under a variety of land uses (agriculture, forestry, urban, wetlands, and other) and climatic conditions.

Multi-scaling
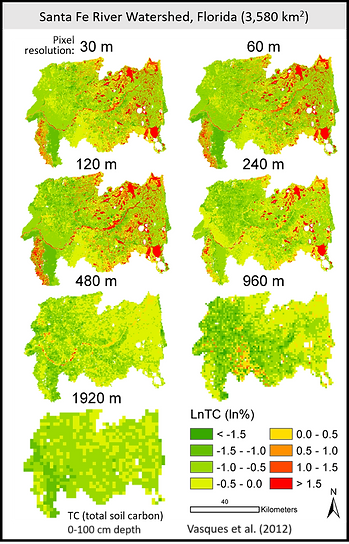
Multi-scale behavior of soil C across various expanding and contracting spatial scales was investigated to (1) analyze whether models are scale variant or invariant (i.e., show self-similar/fractal behavior) and (2) identify the key environmental drivers (natural and anthropogenic factors) that modulate soil C patterns.
The influence of the spatial extent and pixel resolution of input data on soil C models in Florida (Vasques et al. 2012a) and the associations between soil C and ecological variables were analyzed at escalating spatial scales in Florida (Vasques et al. 2012b). In this study soil, hydrologic, and biotic variables mirrored the spatial behavior of total C at fine and coarse scales (few km to hundreds of km scale length). Xiong et al. (2016) investigated scale-dependent variability of SOC coupled to land use / land cover (LULC). This study identified that log-transformed SOC showed variance-
invariant behavior, which had an approximately constant overall variance (sill) of 0.067 (log (kg m-2))2 at field scale (~500 m) irrespective of LULC.
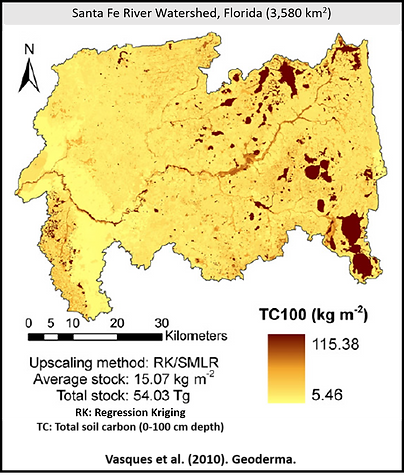
Upscaling of soil C pools using regression block kriging was presented by Vasques et al (2010). Multi-scaling effects using remote sensing data with different spatial resolutions (10 m SPOT, 30 m LANDSAT, and 250 m MODIS) to model soil classes was investigated by Kim et al. (2012). Soil P and N across spatial escalating scales in aquatic ecosystem using satellite images was presented by Kim et al. (2014). Disaggregation and spatial dependence structures using synthetic fields of earthscapes were presented by Grunwald (2008).
The impact of this research are manifold: (1) Knowledge about scaling behavior of properties and processes reduces costs to implement future soil sampling designs and monitoring programs; (2) environmental indicator variables that are sensitive to scaling of soil C should be measured with higher accuracy in future applications; and (3) knowing the critical scale at which a property or process shifts behavior has ecological implications, which in turn impacts ecosystem services, and their valuation.
Biogeochemical Pedometrics
In the Santa Fe River Watershed (SFRW) in Florida spatially-explicit relationships between soil C and (1) labile, recalcitrant, and mineralizable C; (2) nitrogen (N) and fractions; (3) phosphorus (P) and fractions; and (4) numerous environmental landscape properties (e.g., land use, topography, climate, and hydrology) were modeled to better understand interactions between C, N and P biogeochemical cycles and ecosystem processes (Grunwald et al. 2006; Lamsal et al. 2006; Bruland et al. 2008; Grunwald et al. 2010 book chap.; Vasques et al. 2010a, b; Vasques et al. 2012a,b).
Research methods involved GIS, remote sensing, geostatistical, statistical, hybrid (mixed) methods (e.g., Regression Kriging) to implement digital soil mapping and modeling. Soil samples (4 layers, 0-100 cm) were sampled 6 times at 144 sampling sites.

Biogeochemical Cycling in Aquatic Ecosystems
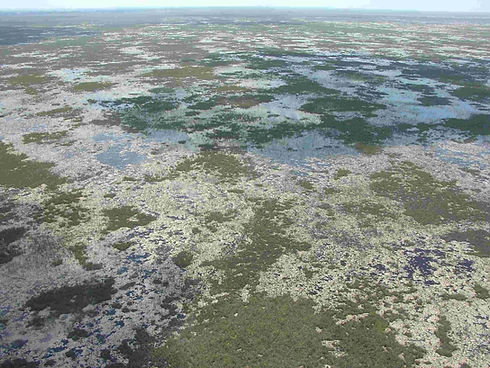
The Greater Everglades in Florida U.S. is an unique aquatic ecosystem that has been impacted by nutrient enrichment due to adjacent agricultural and urban land uses. To understand spatial patterns of biogeochemical soil properties affords to support restoration and mitigation efforts of the Greater Everglades.
Geostatistical and hybrid geospatial methods were used to assess the spatial distribution of various biogeochemical properties in Water Conservation Areas, Everglades National Park, and the whole Greater Everglades (e.g., Grunwald et al. 2004; Bruland et al. 2006, 2007; Corstanje et al. 2006; Rivero et al. 2007; Grunwald et al. 2008; Corstanje et al. 2008; Grunwald and Reddy, 2008; Osborne et al. 2011; Kim et al. 2012). Total P and various forms of P (labile, organic, inorganic, and microbial P) were modeled in the Blue Cypress March Conservation Area (e.g., Grunwald et al. 2006, 2007).
The P memory effect is pronounced in these aquatic ecosystems. Hydropatterns were tightly coupled with multiple biogeochemical variables. Nitrogen, microbial biomass, and other dynamic and labile biogeochemical properties were highly variable across space and time.
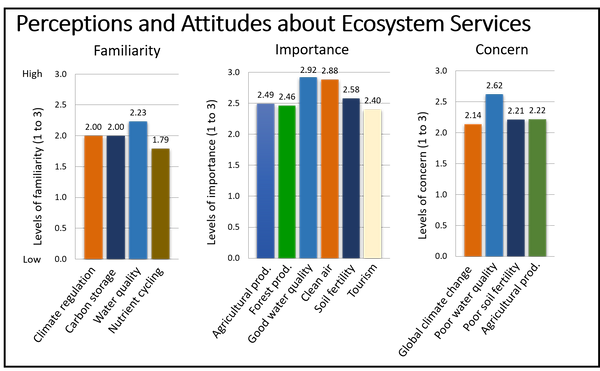
Ecosystem Services
The importance of maintaining and enhancing ecosystem services is a vital basis for delivering benefits to human well-being. Chaikaew (2014) in her dissertation assessed (1) climate regulation, (2) carbon sequestration, and (3) nutrient cycling ecosystem services from biophysical, ecological, and socio-economic perspectives in the Suwannee River Basin, Florida.
The beliefs and perspectives of local residents identified through a survey showed that nutrient cycling was the most important service, and climate regulation and carbon sequestration the least important services, which somewhat contradicted the scientific-based knowledge from the empirical assessments. These data showed that total N loads and P loads in surface waters of the Suwannee River showed relatively less impairment. Soils in the basin acted as a C sink over the past decades. From a science perspective, soils performed critically important functions and provided various services - specifically, C sequestration and climate regulation, and less so nutrient regulation due to the sand-rich, porous nature flushing nutrients into the aquifer.
The socio-economic assessment showed that the willingness of the residents to pay for ecosystem services was extremely low (<$2/household/year), worth less than a fast-food meal (Chaikaew et al. 2017).
The integration of socio-economic and environmental findings was implemented using Bayesian Belief Network (BBN) under four distinct scenarios. Awareness through environmental literacy and adaptation through management were identified as key factors in manipulating ecosystem services.

Soil Quality Assessment in Smallholder Farms
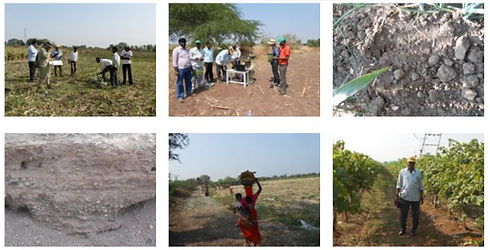
Soil quality and fertility was assessed In the National Science Foundation (NSF) funded project "Geospatial Soil-Crop Inference Engine for Smallholder Farmers in India" (PI: Dr. Grunwald; Co-PI: Dr. Wani, International Crops Research Institute for the Semi-Arid Tropics, ICRISAT). Soil fertility is profoundly important in smallholder farm settings in rural India where the livelihood of families depends on crop yield from small parcels of land (1 to 2 ha) sensitive to climatic variability and water scarcity in rainfed regions.
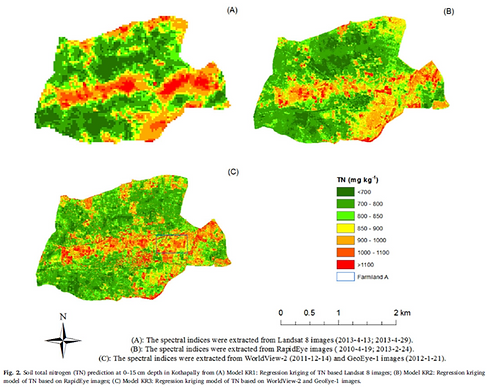
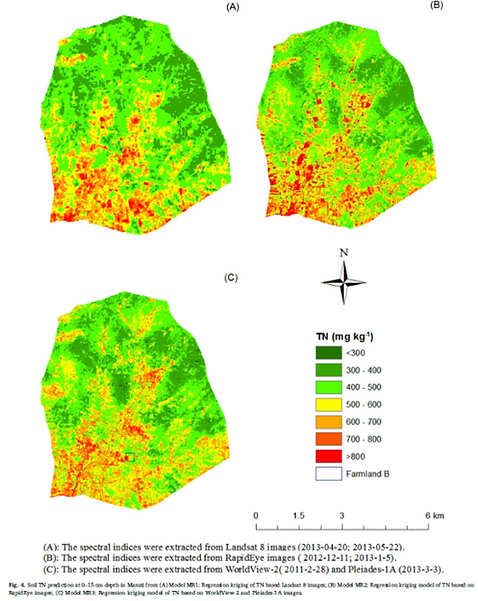
In this project we used spectral sensing technologies - proximal soil sensing (visible/near-infrared spectroscopy, VNIR) and remote sensing images (WorldView-2, GeoEye-1, and Pleiades-1A with 2m spatial resolution and Landsat 8 with 30 m spatial resolution) - to infer on critical soil health indicators. Soil inference models were trained and validated using analytical soil measurements.
Our study region in India comprised two villages. Kothapally (~5 km2) was cropped with cotton (Gossypium sp.), but also rice (Oryza sp.), other grains, pulses, and vegetables. Most of the soil in Kothapally was mapped as Haplusterts, Ustorthents, and Ustropepts with rock outcrops. Masuti (~38 km2) was cropped primarily with maize (Zea mays L.), but also onion (Allium cepa L.), sugarcane (Saccharum sp.), pulses, and other grains. In Masuti the ridges were mapped as Ustorthents and Ustropepts, whereas the lower lying areas have Chromusterts and Ustropepts.
VNIR spectral modeling of 17 different soil properties (including micro and macro-nutrients) was conducted using Partial Least Square Regression (PLSR) and two methods from the genomics field (sparse PLSR and heteroscedastic effects model, HEM) (Clingensmith et al. 2018).
Remote sensing supported digital soil mapping was conducted for total N and exch. potassium (Kex) using pansharpening (Xu et al. 2018a; Xu et al. 2017a), total N using spectral indices and regression kriging (Xu et al. 2018b). We used spatial downscaling of total N and Kex based on weighted generalized additive models (Xu et al. 2017b) and assessed spatial resolution effects of satellite images on prediction of Kex (Xu et al. 2017c).
Water Quality
Water quality has been impaired, specifically in south Florida, with implications for ecological functioning of aquatic ecosystems and public health.
Long-term water quality trends after implementing Best Management Practices were assessed in farm basins in the Everglades Agricultural Area, EAA (Daroub et al. 2009). In the same farm basins, the interactions between phosphorus (P) loads and environmental factors were assessed using tree-based machine learning algorithms (Grunwald et al. 2009). In this study, the monthly P loads (MPL) during the monitoring period showed a maximum of 2528 kg (mean: 103 kg) and maximum monthly unit area P loads (UAL) of 4.88 kg P ha−1 (mean: 0.16 kg P ha−1). Our results suggest that hydrologic / water management properties are the major controlling variables to predict MPL and UAL in the EAA.
We also assessed phosphorus in agricultural ditch soil and potential implications for water quality in the Lake Okeechobee Basin, Florida (Dunne et al. 2007).


Hydrologic and Water Quality Simulation Modeling
Hydrologic and water quality mechanistic modeling supports informed decision making to minimize adverse impacts on the environment (e.g., reduce nutrient loads), place best management practices, and implement restoration plans.
We simulated water quality using the spatially-distributed quasi-mechanistic Soil and Water Assessment Tool (SWAT) in the Sandusky Watershed in Ohio, USA (Qi and Grunwald, 2005; Grunwald and Qi, 2006).
A novel global sensitivity analysis combining Latin-Hypercube and one-factor-at-a-time sampling was conducted considering flow, suspended sediment, total N and P, nitrate, and ammonia at drainage outlets using the SWAT model in catchments in Texas and Ohio, USA (van Griensven et al. 2006). Global sensitivity analysis tackles the problem of over-parametrization of hydrologic simulation models.
An uncertainty assessment method for evaluating models, the Sources of UNcertainty GLobal Assessment using Split SampiES (SUNGLASSES), was presented, which assesses predictive uncertainty that is not captured by parameter or other input uncertainties in simulation models. The SUNGLASSES was applied to the SWAT model in Honey Creek, a tributary of the Sandusky catchment in Ohio, USA (van Griensven et al. 2008).
Development of Simulation Models and Validation
The development of new model code and structures that represents ecosystem processes and overcomes shortcomings of legacy code is arduous and critically important to advance science.
We developed and validated a new mechanistic simulation model (OntoSim) that simulates water flux and P transport using an ontology-based modeling approach (Beck et al. 2010).
The Lyra ontology management system was used which includes web-based visual design tools for constructing models and automatically generating simulation code. OntoSim was calibrated and validated in farm basins of the Everglades Agricultural Area in south Florida (Kwon et al. 2010a, b).
Grunwald developed, calibrated, and validated the AGNPSm water quality simulation model (coded in C++) to assess water quality and suspended sediments in watersheds with complex land use patterns in Germany (Grunwald and Norton, 1999, 2000; Grunwald and Frede, 1999). A Shannon entropy analysis was used to evaluate the degree of heterogeneity of geospatial data; and a spatial sensitivity analysis demonstrated that topographic data were most sensitive to influence peak flow, surface runoff, and sediment yield simulated with AGNPSm (Grunwald, 1996; Ph.D. dissertation). Parameter uncertainty assessment using the AGNPS model was conducted in the Little Washita basin in Oklahoma by Chaubey et al. (1999a, b).


3D Modeling of Soil-Landscapes
3D soil-landscape models were developed using soil coring and 3D interpolation implemented in Virtual Reality Modeling Language (VRML) for field sites in Wisconsin (Grunwald et al. 2000; Grunwald and Barak, 2001, 2003). These 3D visualizations were at the frontier of geo-visualizations at the time. Soils in this region form in glacial till parent material
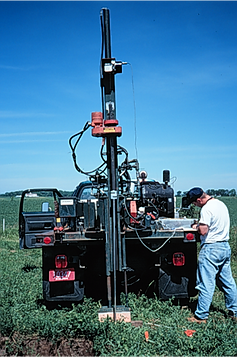
Profile cone penetrometers (PCP) were used to develop pedo-transfer functions that infer on soil physical properties (Grunwald et al. 2001) and to distinguish between soil materials such as glacial till (C horizon), lacustrine sediment (2BC horizon), reworked loess (Bt horizons), and reworked loess (Ap, A/B and B/A horizons) (Grunwald et al. 2001). PCP truck-mounted soil information systems allow to measure penetration resistance (tip and sleeve measurements). The advantage of PCP is the continuous measurement of soil characteristics that support development of 3D representations of soils.